In essence, what crypto-enthusiasts call an Altseason is a magical time in the crypto market where each and every asset shoots for the moon and appreciates by jaw-dropping percentages. During an Altseason, even if you buy a random coin, you are assured of gaining a few percent. But, the Altseason is the perfect time to cash in some juicy x100 on the most promising assets of the cryptosphere.
Cycles in the financial world
“The only thing you can be sure of is that there are times when large numbers of stocks are priced too high and other times when they’re priced too low.”
Benjamin Graham, Security Analysis 1934
Since its inception, the stock market has known repeated cycles of upward and downward trends, also called boom and bust cycles. In the crypto space, everything is faster, but the market remains undoubtedly cyclical, with bull market followed by bear markets and so on.
When is the Altseason in the crypto market?
As you learned in the guide on sentiment analysis, history does not repeat itself, but it does rhyme. The Altseason generally takes place in the first 3 or 4 months of the year following a Bitcoin halving and at the end of this same year. There was a halving in 2016 and two Altseasons in 2017. In the same way, there was an Altseason in early 2021, after the 2020 halving.
Historically, there were three types of Altseasons :
- The initial Altseason at the begining of a bull run
- The final Altseason at the end of a bull run
- The sectorial Altseason that can take place anytime, as long as the market is not in a bearish state
Bitcoin Dominance: The barometer of the Altseason
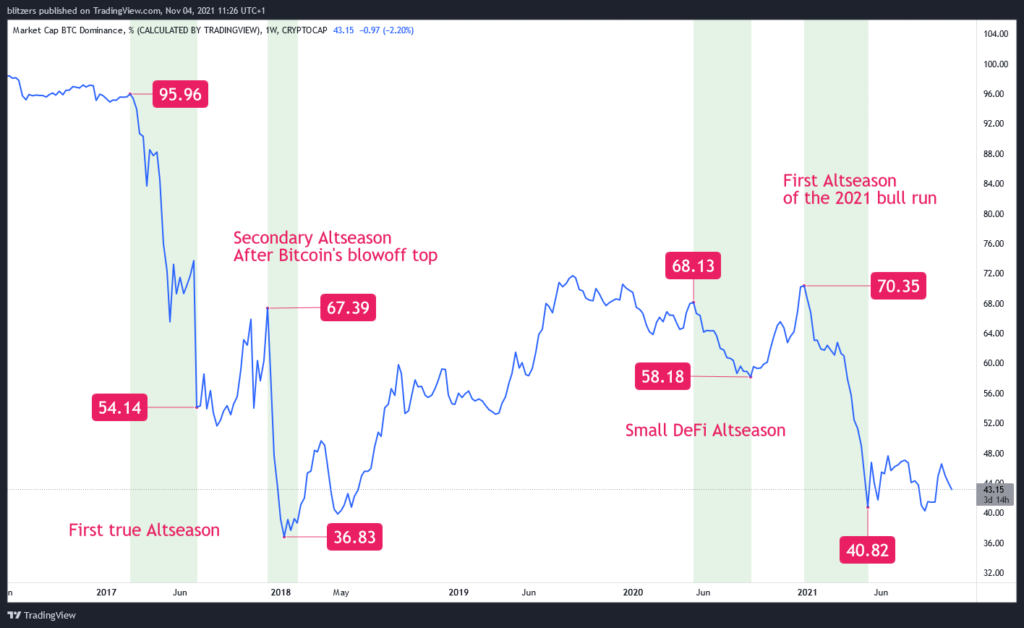
One of the easiest ways to identify an Altseason is to look at the Bitcoin dominance chart. You can either check it out on TradingView or CoinMarketCap. The Bitcoin Dominance chart shows the weight of the Bitcoin market cap in the global crypto market. For instance, a 75% Bitcoin dominance means that Bitcoin’s market cap represents 75% of the total crypto market. Currently, Bitcoin’s dominance sits around 45%.
As you can see on the chart above, there were “only” 3 true Altseasons until now. The first Altseason took place in February 2017 when the second Bitcoin bull run began. At that time, Bitcoin represented 95% of the crypto market, eclipsing by far the other crypto assets.
Soon after, Bitcoin lost 50% of its market dominance while coins like ETH, XRP, and XLM took the spotlight. Then the most famous Altseason took place between the 4th of December 2017 and lasted until the 5th of February 2018. During those three months, literally all the crypto assets in the market rose by at least x10.
Each time an Altseason began, there was a sharp decline in Bitcoin dominance over the crypto market. A good rule of thumb would be to look for a 10% decrease in BTC dominance for the launch of the Altseason; then it ends when Bitcoin’s dominance has reached its bottom after a 40% decrease. During the first Altseason, the dominance fell by 43.5%. For the second, it fell by 45.5%, and in 2021 we had a decline of 42%. As a matter of fact, history does rhyme.
ETH/BTC: The king of alts versus the king of cryptos
Another way to call an Altseason would be to look at the ETH/BTC pair. Since Ether is the leading altcoin, it often moves before the rest of the market. When the ETH/BTC is rising, Ethereum appreciates faster than Bitcoin, which is generally good for the altcoins. A good rule of thumb for detecting a potential Altseason by looking at the ETH/BTC chart would be:
- When the ETH/BTC pair rise significanlly above the 0.03 mark and consolidate above that level, it’s the Altseason
- When the ETH/BTC pair start falling sharply or fall below 0.03, the Altseason is over

By looking at the chart above, you can see that the 0.03 level is a historical inflection point. In March and December 2017, when the ETH/BTC rose above this level, the rest of the altcoin went to the moon. The same can be said for the 2021 bull run. But one point is still up for debate.
Did the Altseason start on the 4th of January or on the 22nd of March when ETH/BTC rose above 0.03 and broke the red downward trend line? There’s no definite answer to this question, but you as an investor should decide for yourself. Do you want to be the first in place for the Altseason, or do you want to be sure the Altseason has come before you place your bets?
The ETH/BTC pair is therefore handy for detecting a major Altseason. Nevertheless, it is less efficient for smaller Altseasons. You can see a green rectangle on the chart above that corresponds to our “Small DeFi Altseason” of summer 2020. Here, ETH/BTC rose above 0.03 without strength. The fact is that this Altseason has been initiated by assets related to decentralized finance (DeFi) and not by Ether outpacing Bitcoin.
The Altcoin Season Index
The most mainstream way of detecting an Altseason is to look at the Altcoin Season Index. According to this Index, the Altseason is upon us when 75% of the Top 50 crypto assets performed better than Bitcoin over the last 90 days. The Altcoin Season Index excludes stablecoins from the Top 50 and backed assets like Wrapped Bitcoins (WBTC).
Because of how it’s calculated, the Altcoin Season Index is generally lagging behind the market. Indeed, taking into account, only the Top 50 crypto assets delay the signal for the Altseason since there are thousands of other assets in the market. For instance, the Index called the Altseason in 2017 only in January, while it started in December.
If you don’t want to miss out on the Altseason, stay tuned and download Dopamine App to stay ahead of the market!


Recent Comments